NHL In-Game Data Display Program
Posted on January 1, 2015 • 2 minutes • 282 words
The below was developed before the current iteration of the NHL’s puck and player tracking statistics.
Once full-time with the Carolina Hurricanes, I became award of the existence of the NHL HITS Scoreboard Interface which transmitted live in-game statistics from NHL statisticians over RS-232 protocol, back to our control room. I wrote a program, which I named HITSVision, to decode that data coming from from the NHL statisticians to distribute that data to each of our control room systems that we could use the data on. Interfaces existed for Daktronics for the HITS data. However, that would, for the most part, restrict the display of this data to Daktronics boards. Via this method, we are able to send data exactly how we want it to appear to our Daktronics boards, as well as directly interface with Ross Video’s XPression API. The advantage of the integration with the API is the ability to instantly display data, namely goals and penalties, anywhere they need to be displayed.
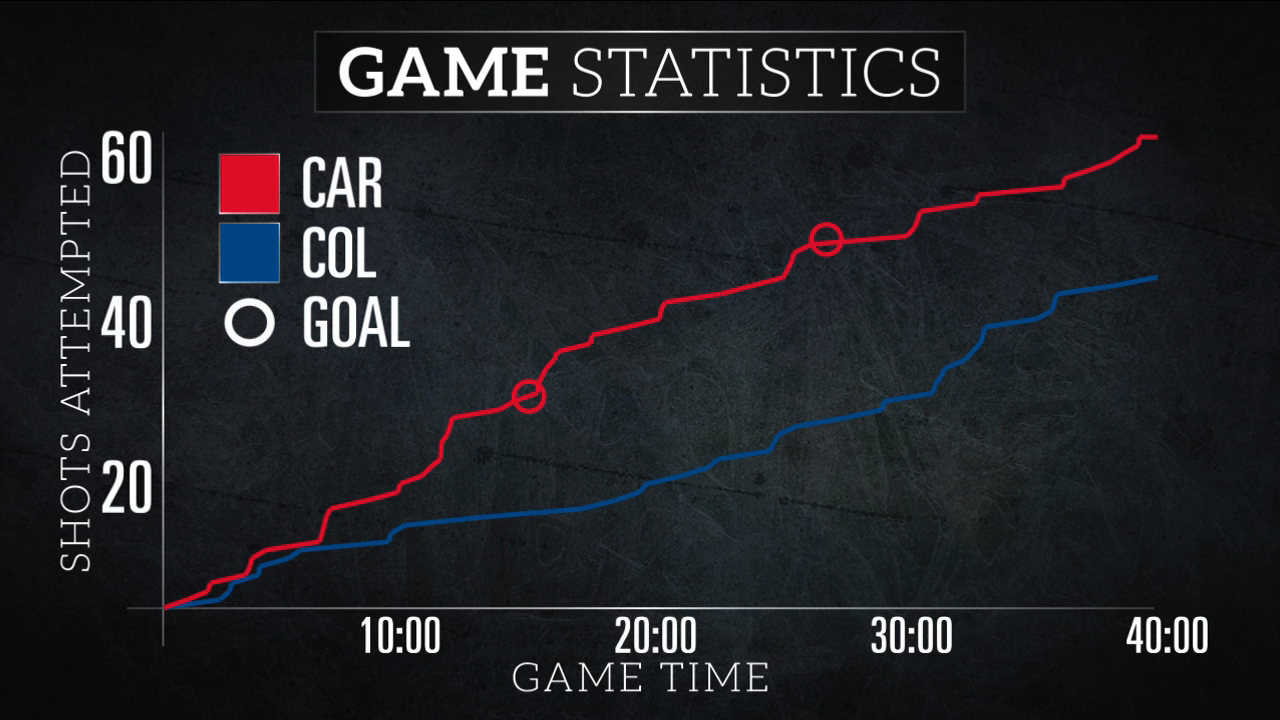
Having an external program to pull HITS data also allows us to leverage data from the NHL’s TVI system, as well as data from NHL.com (which is only used for shot attempts data, seen in images below). Data in the HITS system only pulls current game data, while the TVI system has the ability to pull much more comprehensive data, including season and career data by player and team, statistics by zone and strength, league and team statistics leaders, shot charts, shootout statistics, and much more.
An all-in-one program, HITSVision integrates all this data from several sources, allowing for automated display of statistical lower thirds of any type, team data, live on-ice player listing, and charts display.